Investigation of a fish-farming tank - Hydrodynamics and health
Fish-farming tanks need to have moving waters to ensure fish health.
We present here the study of a tank with European seabass (Dicentrarchus labrax). They might contract a disease called vibriosis, caused by Vibrio harveyi. In the tank, V. harveyi is present in a planktonic form because of environmental water supplying the rearing tanks. V. harveyi could also be present in biofilms on the walls of the tanks. These biofilms could act as a reservoir of pathogenic bacteria and thus increase the persistence of V. harveyi and its potential resistance to biocides.
The project is entitled “CAractérisation hydroDYnamique d’un bassin aquacole pour appréhender la formation de biofilms BACtériens” (CADYBAC). Its objective is to study the heterogeneity of hydrodynamic properties in the tank (particularly caused by the water inlets and outlet and the movement of the fish) to identify potential microenvironments favourable to the development of bacterial biofilms.

A first measurement campaign in September 2023 consisted in two types of measurement:
- The LISIC laboratory characterised the flow in the tank. To understand the hydrodynamics of the tank, velocities and turbulence were measured by the means of a high resolution ADCP from Ubertone.
- The UMRt BioEcoAgro performed sampling of biofilms for sequencing. For now, 6 sampling points per 3 depths were repeated 3 times to get a total of 54 points.
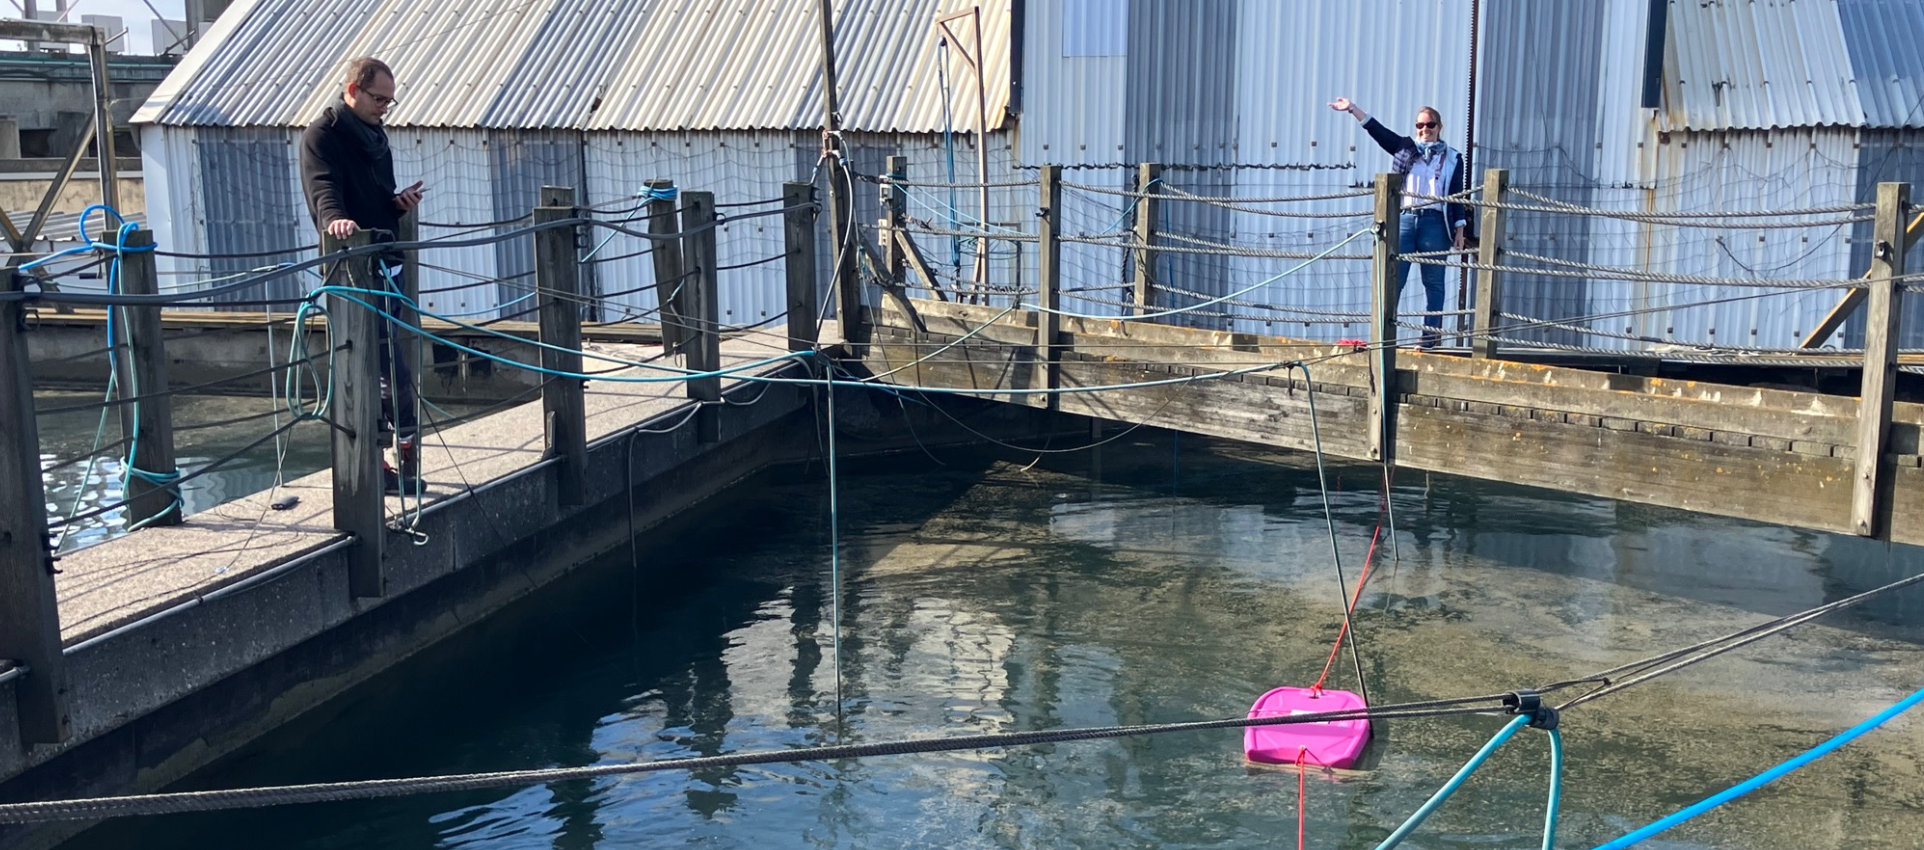
The tank’s dimensions are 15×15×4m, fishes were present inside during the measurements. There is an oxygen bubble generator, two water inlets and one outlet.
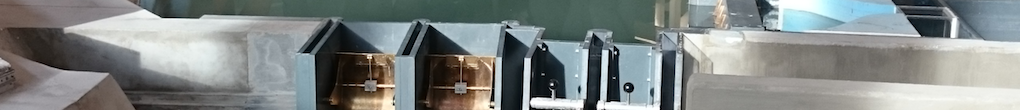
The velocity measurements were performed with a UB-Lab P and two 500kHz transducers. Using two transducers allows obtaining average 2C velocity profiles, see 2C monostatic UVP. Positioning them in the XZ plane or in YZ plane allows obtaining average UW and VW profiles.
For the measurement of vertical UVW profiles, the transducers were placed in a floating board at the surface and moved around the tank to grid it. In total 64 static profiles per plane were averaged for 2 minutes each.
Positioning the transducers from the side walls and observing only the crossing point between both acoustic beams allows getting a better time resolution and removes the spatial averaging factor. These point measurements were performed in 12 points, repeated at two depths, for 2 minutes each, and allowed estimating U’ and W’.

The analysis of the average UVW velocity profiles measurements showed:
- That the Gyre is of low magnitude (~5cm/s).
- Intermittent vertical velocity bursts increasing the velocity magnitude locally (~10cm/s).
- That the Gyre intensity decreases with the depth.
- The measurements were limited to 2m depth.
- There were localised noisy velocity measurements due to the presence of oxygen aerators at the bottom of the tank.


The analysis of the turbulent intensity defined by:, showed:
- There is a vertical gradient of turbulent intensity.
- There is a heterogeneity due to plunging water masses.

The next step of this project will be to link the hydrodynamics measurements with molecular and microbiological sampling data to give indications to the farmers on how to adapt the zootechnic conditions to reduce the risks of vibriosis.