Pumping station efficiency study in Italy
The Po Valley is among the most important agricultural areas in Europe, the river is extensively used for irrigation. Annual precipitation over the whole Po River basin is estimated at around 78 km3, about 21% of that is used for irrigation. The Canale Emiliano Romagnolo (CER) is paramount to provide water for civil and agriculture uses in the Romagna Region which sustains 1.2 million habitants and rich farming (fruit and greenhouse) in the northern part of Italy. CER main supply of water is from the Po River, this is pumped by the Palantone station. In that Region, the climate change augmented water needs for irrigation by 20-25% because of increasing evapotranspiration that required the Palantone pumping station enlargement.
New pumping pipes delivering additional 20 m3/s for a total of 70 m3/s from the river to the irrigation network were installed in the Palantone lifting plant. A study is performed on those new pipes to contribute to the efficient use of resources and to support agriculture production of the Region in times of water scarcity.

![]()
![]()

This efficiency study performed by Prof. Massimo Guerrero from the University of Bologna for CER went on successfully.
The following conference paper presents more details about the results: Massimo Guerrero. (2024). Velocimetria doppler per la determinazione della portata liquida in grandi condotte. Conference: XXXIX Convegno Nazionale di Idraulica e Costruzioni IdraulicheAt: Parma, Italy, 15-18 Ottobre, 2024
Ubertone designed and provided DN125 transducers holders and the measurement instrument: a UB-Lab P velocity profiler with 500kHz transducers. Four holders were integrated by CER in the 1800 mm diameter pipe sections.
The embedded web-interface of the UB-Lab P allowed real-time visualisation, parameter adjustment and recording management.
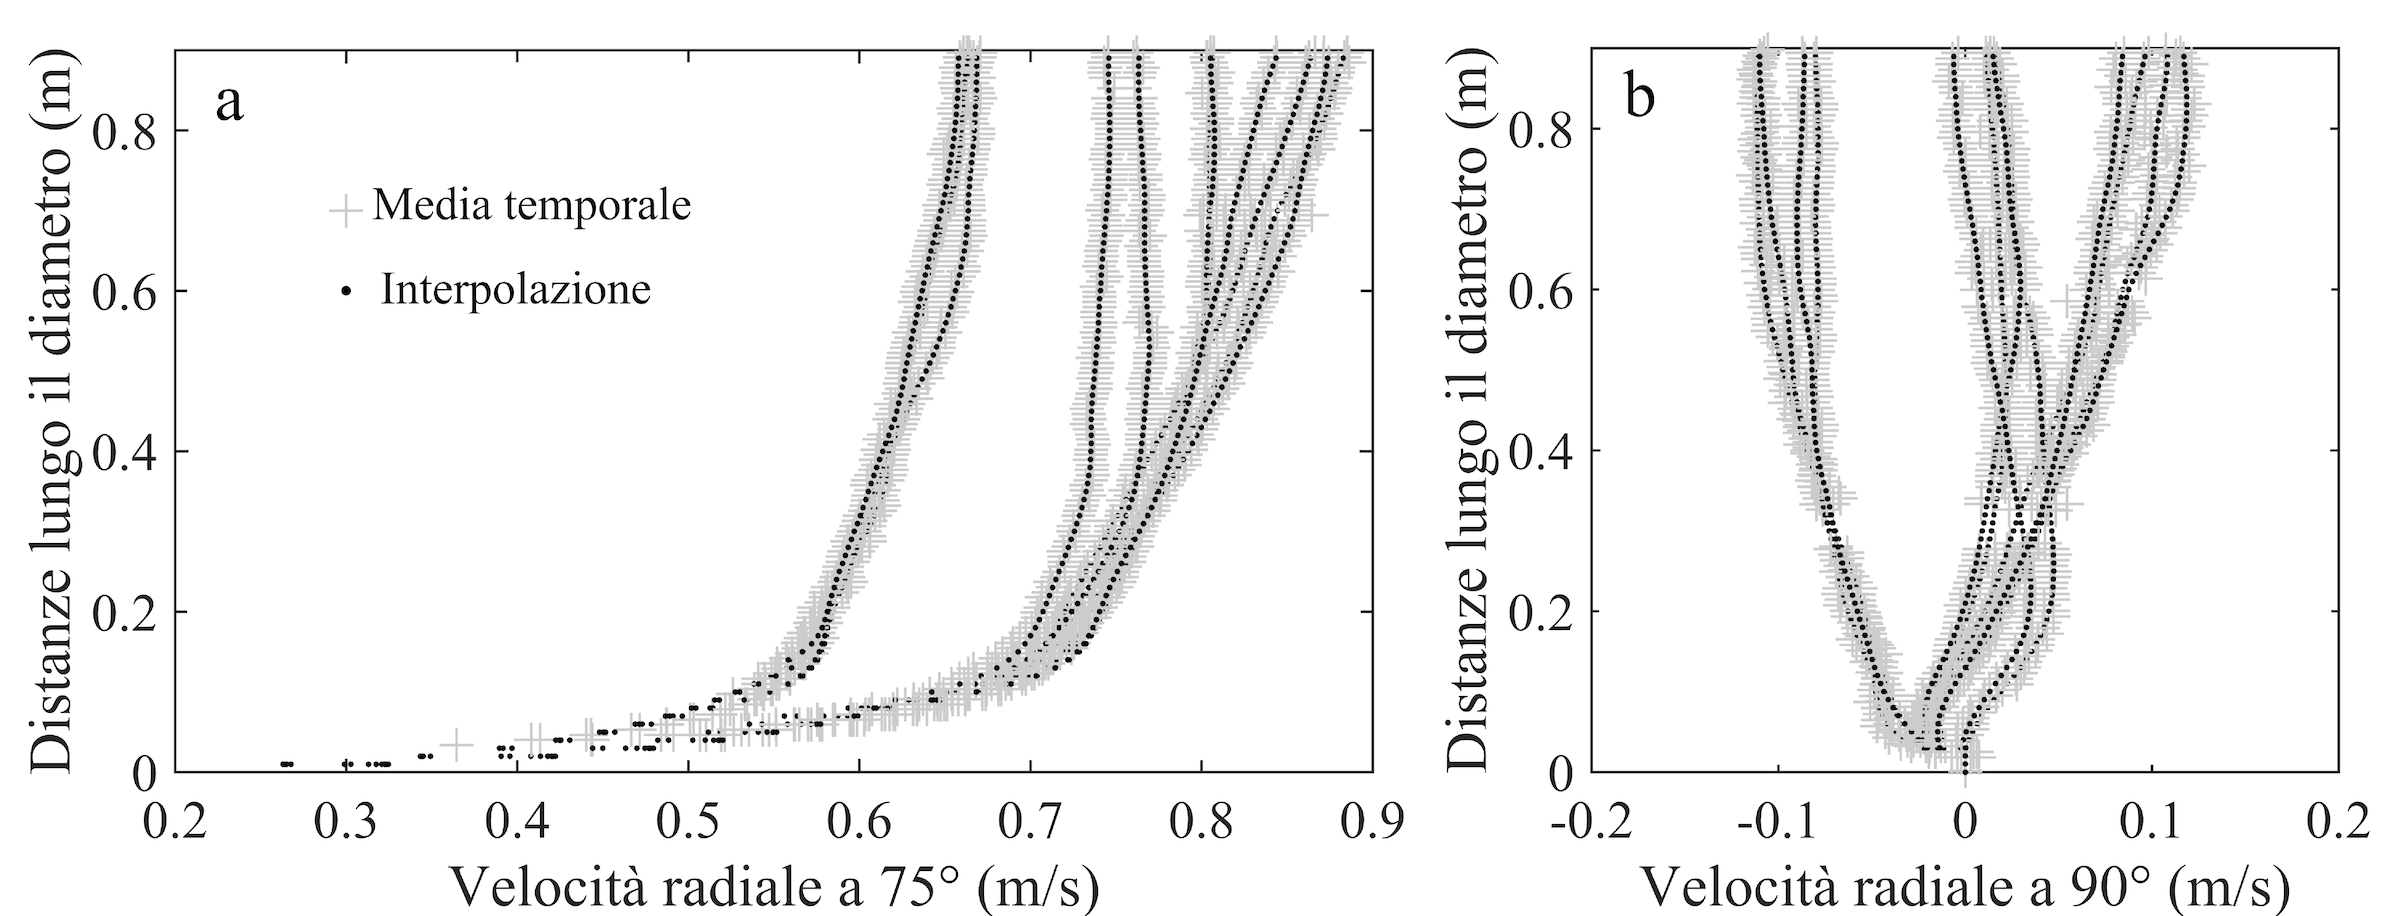
Each bracket can hold two transducers, oriented with two different angles. The post-processing of the data allowed obtaining average 2C velocity profiles along several diametral lines of the pipe.
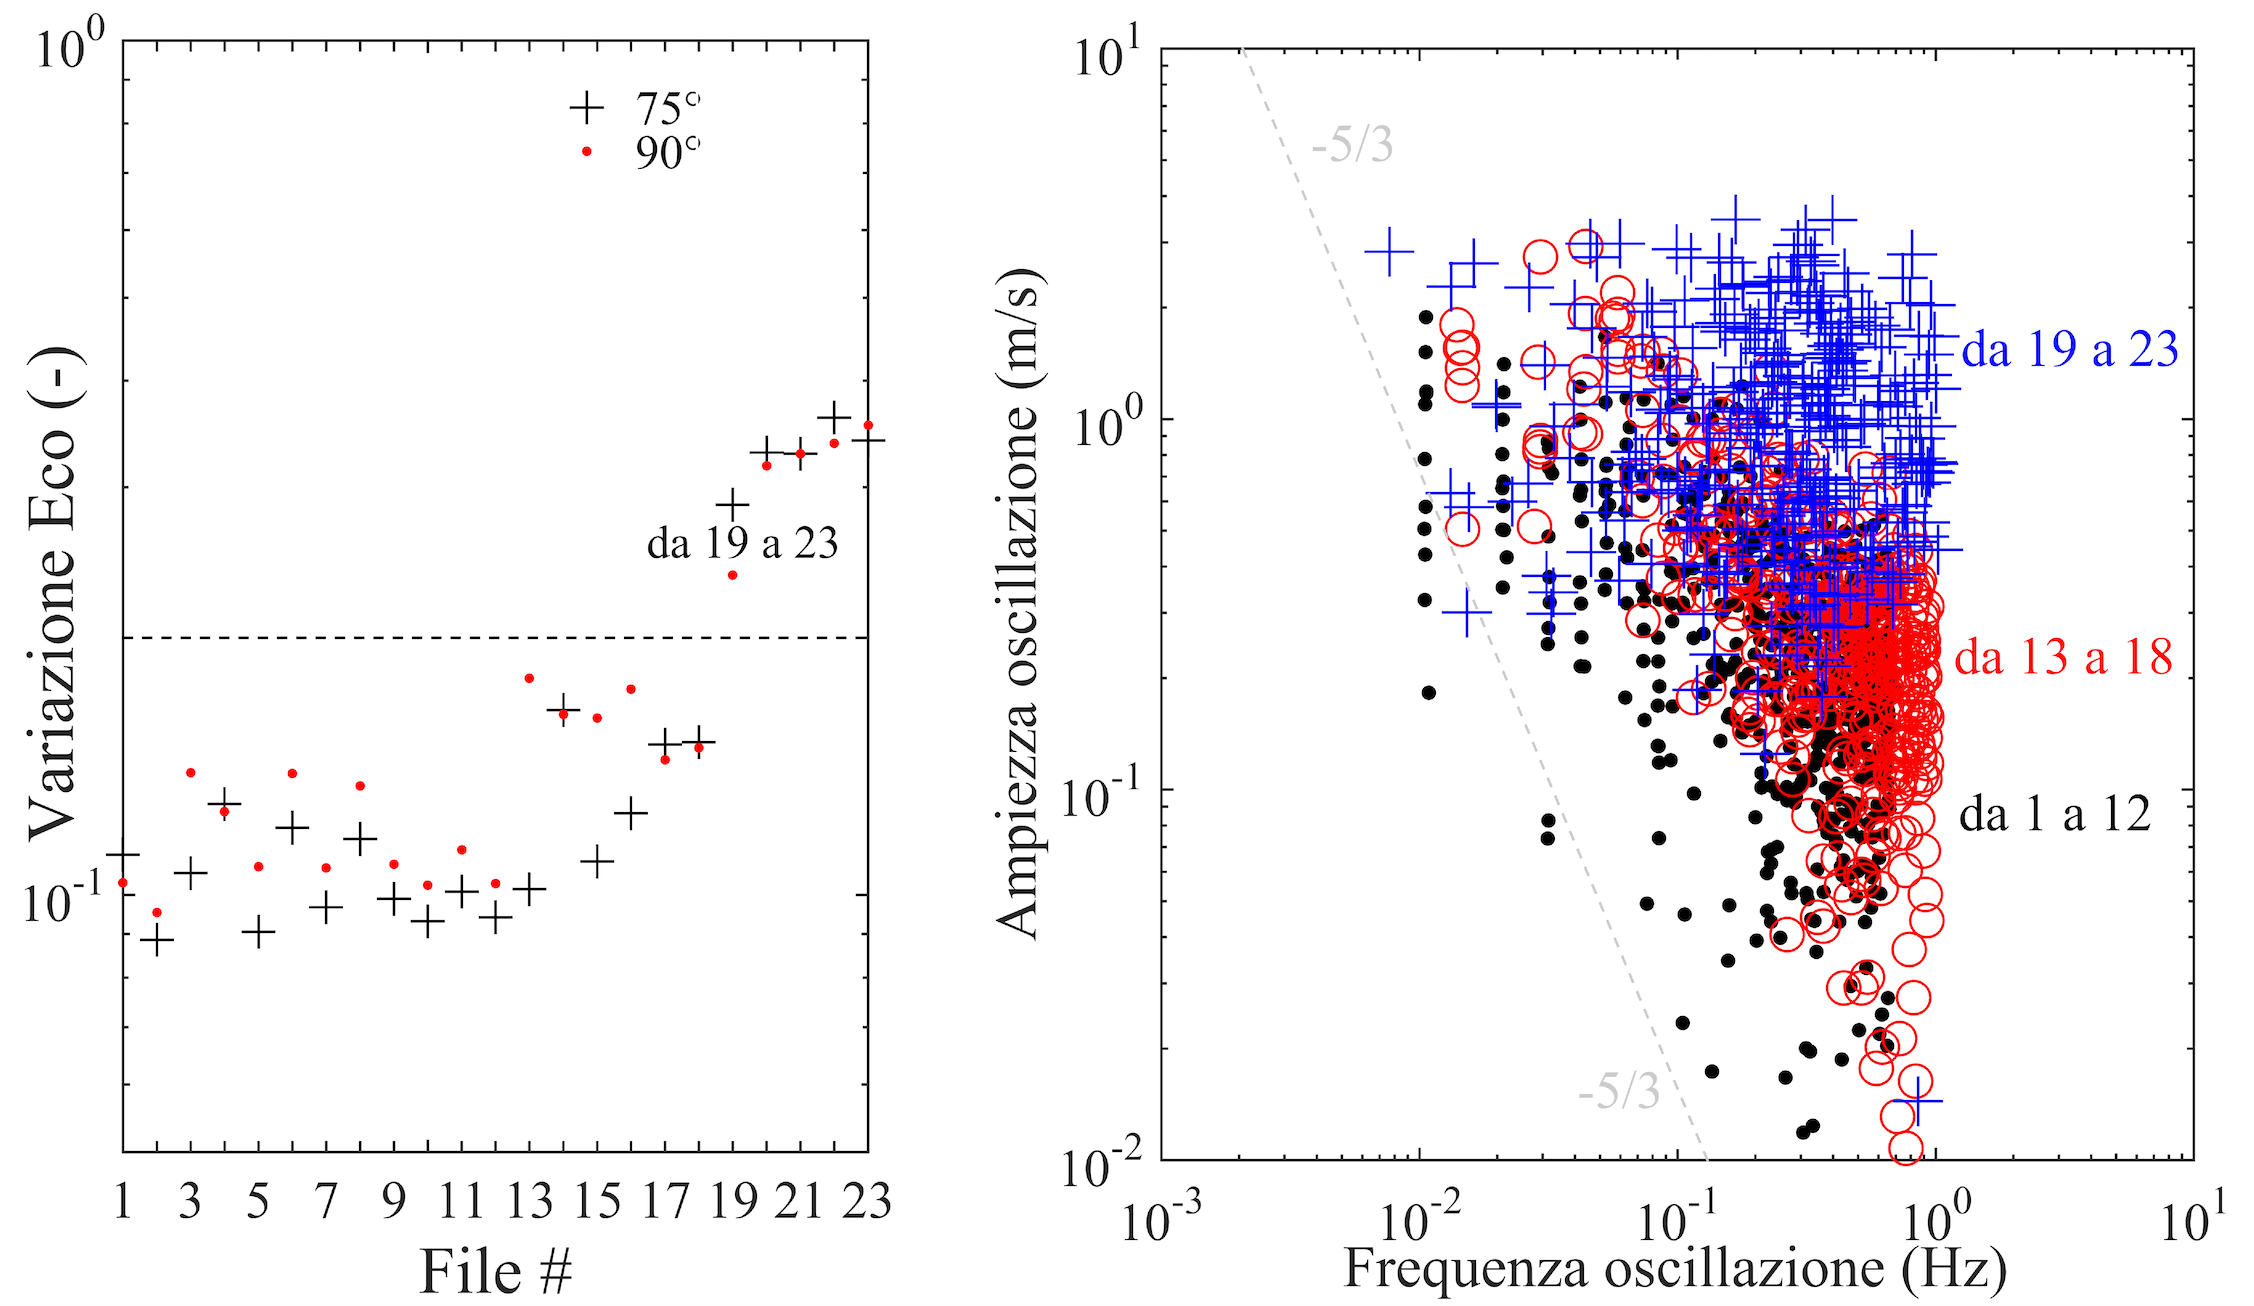
Assuming steady flow condition, UB-Lab P averaged profiles of Doppler velocities (i.e., projected on the beam axes) were repeated hundreds of times for 3-4 minute intervals and along pipe 4 radial alignments which were 90 degrees spaced at each duct. This provided the entire profiling of flow velocities along pipe 2 perpendicular diameters and assuring a certain overlap at pipe axis. Raw profiles were de-spiked, filtered based on SNR values, de-aliased, time averaged over investigated intervals and finally composed to give the profiles of mean flow velocity components in the pipe axis direction and along the diameter. Turbulent flow profiles (i.e., the logarithmic law) were fitted over not-measured regions close to boundaries. The mean velocity over the pipe cross-section and corresponding flow discharge were finally assessed by the profiles integration over the diameter. Repeated estimations at 90 degrees spaced diameters and the overlapping region at pipe axis gave 2% uncertainty for flow discharge assessment.

Back to the news list.