2-3C bistatic velocity measurement

The multi-bistatic technique provides an instantaneous two component (2C) velocity vector measurement along a single beam (1D profile) at a high spatial and temporal resolution. This technique, also known as ADVP (Acoustic Doppler Velocity Profiler), provides many informations such as instantaneous velocity gradients, Reynolds shear stress, turbulence spectrum, flow direction as a function of depth, flow eddies generated by an obstacle, etc. [Shen 1997, Mignot 2009]
The UB-Lab 3C from Ubertone allows to perform symmetric bistatic measurements over an up to 50cm deep profile (depending on the emission frequency). It consists in measuring simultaneously, along a narrow beam, the projection of the velocity vector V over two observation angles. Then, both components of the velocity profile V are computed in the orthonormal coordinate system (x, y). Such a profile is obtained at a high spatial (1.5mm) and temporal resolution (up to 100Hz).
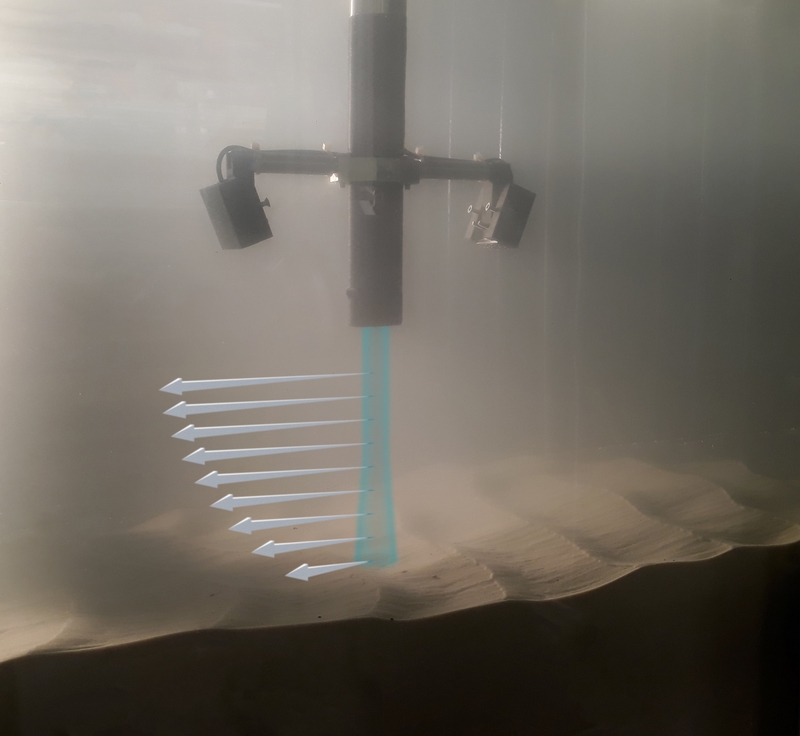
The figure above presents an example of installation adapted to the 2C velocity profile measurement in a flow, with three transducers. Tr0 is emitting with a narrow beam. Tr1 and Tr2 are a pair of spreaded beam receivers, located on both sides of the emitter and inclined at an angle α from the emitter’s axis. The transducers are plugged into the UB-Lab 3C profiler. The measurement cells are distributed along the narrow (green) beam constituting the profile. The fluid's velocity \( V \) in one cell, with an angle \( \varphi \) to the main flow direction, can be observed through the projected velocities on the bisectors of the emitters and receiver axes. The norm \( |V| \) and the angle \( \varphi \) of the velocity vector are then computed using trigonometric relations.
The triplet of transducers is oriented in a vertical plane, parallel to the main flow direction, to provide the streamwise and vertical flow velocity. To measure the streamwise and lateral flow velocities, the three transducers need to be set in a horizontal plane.
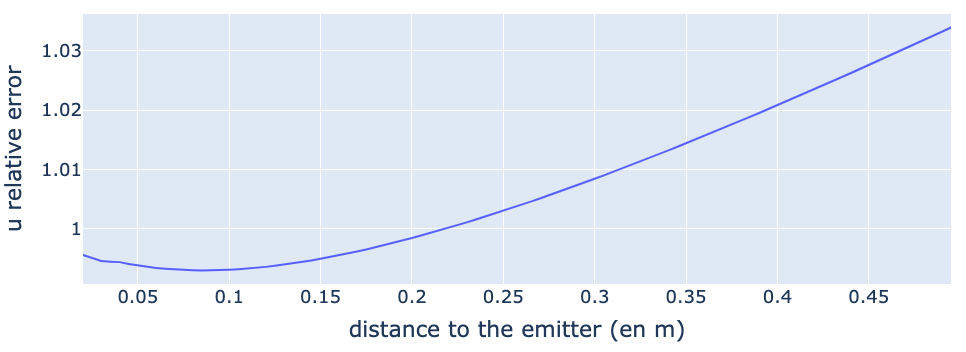
Our instruments calculate the along–beam velocities with a very good accuracy (below 0.5%). However, when considering the processing of the streamwise component u, the parallax bias is potentially an important source of error. Indeed, the velocity u is impacted by a cell distancing from the emission axis.
This distancing is close to zero near the focal point (or sweet spot). Beyond this point, the centre of the cells may deviate from the emission axis.
The transducers’ geometry and position is the unique source of this bias, which can be minimized through an adapted geometry, if the desired profile to measure is of reasonable length.
UBERTONE has thus optimized the geometry of the 1MHz bistatic transducers holder to minimize this bias. The theoretical error stays below 1% over 30 cm.

By using a second pair of receivers (transducers Tr3 + Tr4), in a plane perpendicular to Tr1 and Tr2, it is possible to obtain the averaged 3 components velocity along the emitted beam axis.
Shen C. and Lemmin U. (1997) A two-dimensional acoustic sediment flux profiler, Measurement Science and Technology, 8, 8, pp. 880-884
Mignot E., Hurther D., and Barthelemy E. (2009) On the structure of shear stress and turbulent kinetic energy flux across the roughness layer of a gravel-bed channel flow, Journal of Fluid Mechanics, 32, pp.423-452
